SHOW ON MAP
COMPARE DATA
About
Dear User,
Settlement dynamics have profoundly reshaped the social and economic geography of West Africa over the past 60 years. Urbanisation and the development of dense urban networks are the most spectacular demonstrations of population redistribution. To better analyse and describe these dynamics at the regional level the Sahel and West Africa Club Secretariat (SWAC/OECD) has used new and homogenous urbanisation data and modeling.
The data presented here has been compiled from various sources, harmonised and further developed over the course of a two-year programme on “Settlement, market, and food security”. The final report concludes a series of studies on the West African settlement and market dynamics and presents key issues for policy makers. The report is soon available on the SWAC website.
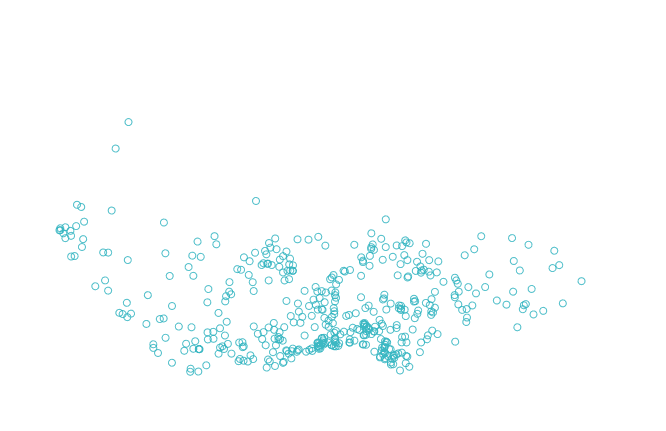
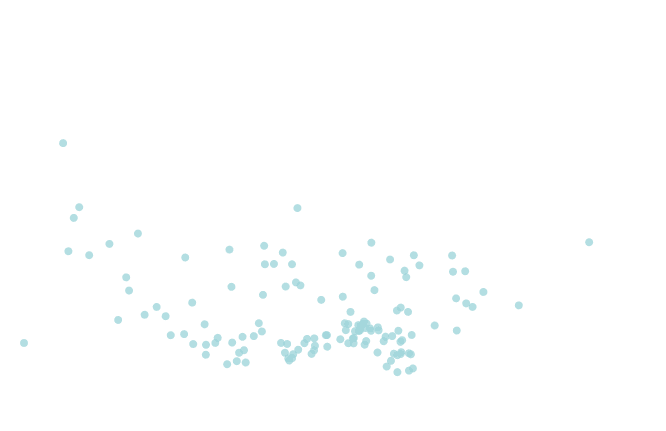
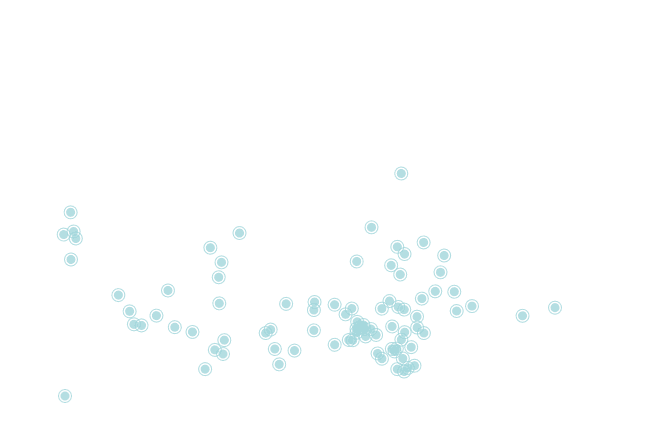
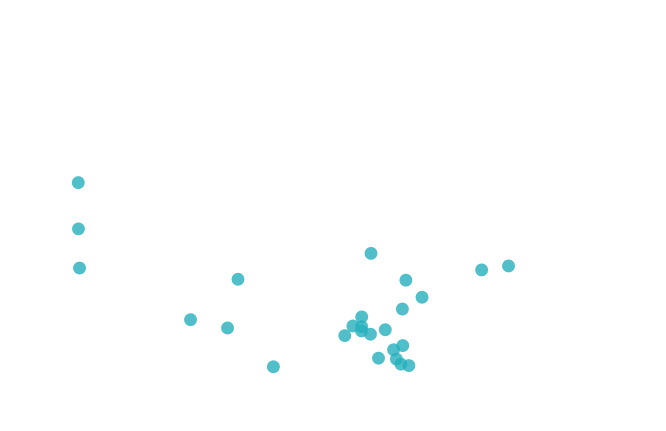
The data of the Statistical, Mapping and Regional Analysis Tool — SMART illustrate these dynamics and transformations. SMART allows you to map, follow and compare key settlement data for the 17 West African countries and country groups between 1950 and 2050. By linking this data with agricultural performance it also provides examples on how settlement dynamics change the way we interpret past trends and assess future potential. We consider SMART as work in progress and encourage users to provide feedback, ideas and suggestions to help us further develop and broaden it. Data can be downloaded as excel file; graphics and maps are available as jpeg files.
Enjoy using SMART!
Laurent BOSSARD, Director, Sahel and West Africa Club Secretariat
The data presented here has been compiled from various sources, harmonised and further developed over the course of a two-year programme on “Settlement, market, and food security”. The final report concludes a series of studies on the West African settlement and market dynamics and presents key issues for policy makers. The report is soon available on the SWAC website.
The data of the Statistical, Mapping and Regional Analysis Tool — SMART illustrate these dynamics and transformations. SMART allows you to map, follow and compare key settlement data for the 17 West African countries and country groups between 1950 and 2050. By linking this data with agricultural performance it also provides examples on how settlement dynamics change the way we interpret past trends and assess future potential. We consider SMART as work in progress and encourage users to provide feedback, ideas and suggestions to help us further develop and broaden it. Data can be downloaded as excel file; graphics and maps are available as jpeg files.
Enjoy using SMART!
Laurent BOSSARD, Director, Sahel and West Africa Club Secretariat
Enter
Urban Population
Lorem ipsum dolor sit amet, consetetur sadipscing elitr, sed diam nonumy eirmod tempor invidunt ut labore et dolore magna aliquyam erat, sed diam voluptua. At vero eos et accusam et justo duo dolores et ea rebum. Stet clita kasd gubergren, no sea takimata sanctus est Lorem ipsum dolor sit amet.
Total Population in million
City size by population
20000 - 50000
50000 - 100000
100000 - 350000
350000 - 1 million
1 - 2 millions
> 2 millions
1
2
3

test
DOWNLOAD data
Selected file(s)
ADD COUNTRY(up to 5)
About the data
The data presented in this tool illustrates how settlement dynamics have emerged and changed over time, and covers the period from 1950 to 2050. It helps to understand the region’s shift between rural and urban population and its effect on the ratio between agricultural and non-agricultural population. The research draws from multiple sources and the data has been harmonised by the authors to provide a coherent picture of the development in West Africa. For more details on the methodology for this harmonisation as well as background information you can access the series of notes that preceded the report. SMART is largely drawing on West African urbanisation data produced by Africapolis (2008) which is based on satellite and aerial imagery as well as census data to estimate the number of agglomerated people in 1950, 1960, 1970, 1980, 1990 and in 2000.
About the tool
This data tool was realised in cooperation with Thomas Ranker of Red Rooster Mobile who developed this tool and designed by Daniel Krüger of grand krü.
Data Sources and Methodology
Mali
19xx
Inhabitants
Quality sites
- Migliori Siti Casino Online
- Casino En Ligne
- Non Gamstop Casinos
- Casinos Not On Gamstop
- Non Gamstop Casinos
- Non Gamstop Casino
- Casino Not On Gamstop
- Non Gamstop Casinos
- Casino En Ligne
- Casino En Ligne
- Non Gamstop Casinos
- Casinos Not On Gamstop
- Slots Not On Gamstop
- UK Online Casinos Not On Gamstop
- UK Casinos Not On Gamstop
- Reputable Non Gamstop Casinos
- Non Gamstop Casino UK
- Migliori Siti Scommesse
- Best Casino Sites UK
- Casino Not On Gamstop
- Meilleur Casino En Ligne France
- Casino Sites Not On Gamstop
- Sites Not On Gamstop
- Best Betting Sites Not On Gamstop
- I Migliori Casino Non Aams
- Migliore Casino Non Aams
- Betting Sites Not On Gamstop
- Crypto Casinos
- Sites De Paris Sportifs Autorisés En Belgique
- букмекерские конторы
- Casino Français Sans Kyc
- Casino En Ligne Argent Réel
- Meilleur Casino En Ligne France
- Meilleur Casino En Ligne 2026
- Meilleur Casino En Ligne
- Crypto Casino Online 2026
- Migliori Casino Online
- 온라인 슬롯
- Casino Online Non Aams
- Siti Casino Non AAMS
- Nuovi Siti Casino Online
- Coinpoker App
- Casino En Ligne Neosurf
xxxxx
19xx
Urban Population
xxx
Total Population
xxx
Rural Population
URBAN
Urban network
POPULATION
Total population
Urban population
Rural population
Level of urbanisation
Ratio urban/rural
Agricultural population
Non agricultural population
Ratio non-agri pop/agri pop
Rural non-agriultural pop
Urban agricultural pop
Population growth
Urban population growth
Rural population growth
Agricultural population growth
Non-agricultural pop growth
AGRICULTURE
Agricultural production
Food imports
Imports per capita
Imports per urban
Harvested area
Area/agricultural pop
Yield
Agricultural productivity
Production growth
Import growth
Imports per capita growth
Imports per urban growth
Yield growth
Productivity growth
some country
some year
some value